Planner guide
The Planner holds a project's schedule, resources, baselines, progress, actuals, risk and change in one document, and reschedules after every edit. This guide follows the rail from File to Panels and the bottom pane across its tabs.
The window
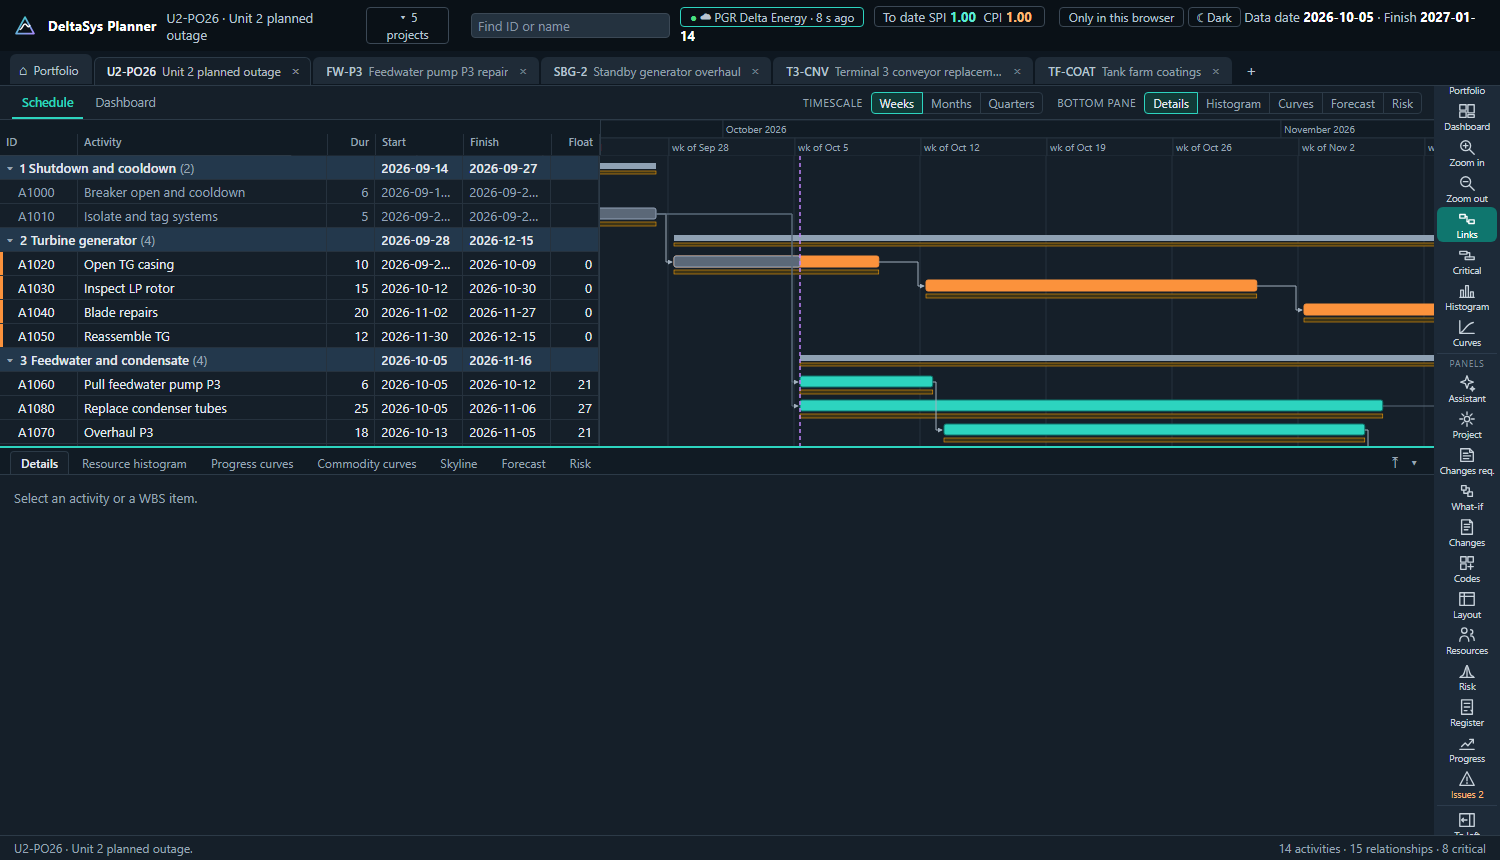
Every open project is a tab across the top; the Portfolio tab is always first. The Schedule view shows the activity table and the Gantt chart; the Dashboard view shows the project at a glance: forecast finish, progress, SPI and CPI, cost at completion, manpower, risk, change requests, schedule health and the earned value S-curve. The timescale switches between weeks, months and quarters; zoom in and out from the rail.
Project health is one rule everywhere: green is healthy, yellow is at risk, red is in trouble, blue is complete. Red means something is already wrong: past the must-finish date, ten or more working days behind the baseline, negative float, SPI or CPI below 0.90, or a risk analysis whose P50 finish falls after the target (the must-finish date, else the baseline finish). Yellow means something is slipping: behind the baseline at all, SPI or CPI below 0.95, progress ten points behind plan, a P80 finish after the target, open changes worth over 5% of the budget, or schedule quality checks under 85% passed. The Portfolio's Projects view shows the projects as cards (Columns: Cards) with the status, a dial of per cent complete against the planned figure, the finish against the baseline, SPI, CPI, the cost at completion against the budget, an activity progress bar and the reasons behind the status; the Overview opens with a portfolio dial and the count of projects in each state; the phone layout carries the same labels.
The status bar at the bottom reports the last action on the left and the activity, relationship and critical counts on the right. The header shows the period SPI and CPI, the data date and the forecast finish.
On a phone the Planner opens a read-only layout instead of the workstation: a portfolio page (projects, progress, SPI and CPI, cost at completion, open changes, critical work, peak manpower, the projects that need attention, the next milestones and the monthly cash flow), a project list and a project page with the same figures for one project, its milestones and its cash flow. The figures are the same roll-up the Portfolio tab uses. Nothing can be changed from a phone; the More tab sends the link to a bigger screen, switches the theme and signs in or out. A viewport narrower than 900 px gets this layout, with the full layout available on request.
WBS and Cost accounts are two more views beside the Schedule and the Dashboard. The WBS view is the work breakdown structure as a tree, each node with its roll-up (activities, done, critical, finish, per cent complete against planned, BAC, PV, EV, AC, EAC, VAC) and the cost account it falls under. The Cost accounts view is the finance system's chart of accounts laid over the schedule: import it as a CSV (code, name, parent, budget, committed, actual, as of) from JD Edwards, SAP, Workday, Oracle Fusion, Dynamics or any ledger, add accounts by hand, or let a Connection deliver cost codes and actuals; assign an account to a WBS node and everything below it is charged there, or give an activity its own account in its General tab. Each account then shows the schedule's budget, earned and actual over the work charged to it beside what finance reports, so earned value reads against the ledger.
Company rules live in the Portfolio's Enterprise view (Company rules): the currency every budget, cost, rate and variance is shown in (figures are stored as plain numbers; the currency names them), and the reporting period: weeks ending on a chosen day, calendar months, or days. The WBS view edits the structure too: the WBS ID and name in place, a new WBS under any node to any depth, and removal of an empty node.
Activities and logic
Select a WBS node and add an activity from the rail. An activity has a type (task, start or finish milestone, level of effort), an original and a remaining duration, a calendar, and optional primary and secondary constraints (start or finish on, on or after, on or before, as late as possible). Relationships are typed FS, SS, FF or SF with a lag in hours; a lag can run on the predecessor's, the successor's or a 24-hour calendar.
The Details pane edits the selected activity: dates and status, relationships, resources, expenses, steps, quantities, codes, risk and notes. Right-click an activity for the context menu. Undo and Redo cover every edit.
The Issues panel lists open ends, loops, out-of-sequence progress and unsatisfied constraints, and scores the schedule against the DCMA 14-point assessment.
Calendars and holidays
The Project panel holds the calendars: a working week of hours a day and days a week, with exceptions. Add statutory holidays for a Canadian province or a US state for a range of years in one click; name individual days. An activity can use a calendar other than the project's, for example a 7x10 outage calendar inside a 5x8 project.
Resources and rates
The Resources panel lists labour, equipment and material resources with a code, a limit (units available at a time) and a rate per hour. A rate can be a single figure or built up from a base wage plus a rate set: payroll burden, benefits, small tools, overhead and profit as percentages of the wage, dollars per hour or percentages of the running total. Rate sets come across from the Estimator with the estimate.
An assignment is a resource on an activity with a crew size and, when it differs, its own rate and spread (even, front, back, bell). Level resources keeps every resource within its limit by delaying work; the leveled dates are shown beside the early dates.
The Resource histogram tab in the bottom pane shows units and cumulative hours by week for one resource, all labour or all equipment, stacked by resource, type, WBS or activity code. Skyline shows the activities finishing each week, by status.
Expenses
An expense is a cost on an activity that is not a resource's hours: material, subcontract, equipment hire. It has a category, a budget and, once known, an actual. Expenses are part of the activity's total cost, the cash flow and the earned value.
Baselines
A baseline is the schedule as it stood: each activity's start, finish, duration, cost and quantities. Keep one from the Project panel at any time; the first kept becomes active. Another project in the browser can also serve as a baseline, matched by activity ID. The active baseline draws as the thin bar under each activity, feeds the variance columns and is the performance measurement baseline for earned value.
Progress and earned value
Progress is recorded with the Update panel. Set the new data date, then for each activity in the period: started or finished, the actual dates, the remaining duration or the percent complete, and the hours worked. Activities that ran to plan can be auto-completed. Recording the update stores a snapshot of planned value, earned value and actual cost at the old data date, so the curves and the period indices build up month by month.
Percent complete can come from the remaining duration, from steps (rules of credit, weighted) or from installed quantities; the project chooses which.
The Progress panel shows the earned value at the data date: PV, EV, AC, the variances, SPI and CPI, the EACs (remaining work at budget, performance to date continuing), ETC, VAC and TCPI, overall and by WBS, in cost, labour hours or duration. Thresholds flag a variance that needs a variance analysis. The Progress curves tab plots the S-curves and the recorded updates; Commodity curves plots installed quantities against plan and the rate needed to finish.
Period performance. Every progress update is recorded at its data date with the project's planned, earned and actual value and each activity's figures. The dashboard's Period performance panel and the report's Period performance section cut those records by the company's reporting period: for each period its own PV, EV and AC (the difference from the period before), SPI and CPI for the period and to date, and this period beside the previous one and the cumulative. The period holding the data date is open; a period in which no update was recorded is marked, its figures a straight line between the updates either side. The update panel proposes the next period's end as the new data date, so the records fall on the company's periods.
Actuals from timesheets and contractor costs
The Actuals panel imports timesheets (worker, trade, charge code, hours, overtime) and contractor costs (vendor, reference, charge, category, amount; invoice, accrual or reversal) from CSV or pasted rows. Charge codes are matched to activities and trades to resources, once, and remembered. The lines become the actual hours and cost on assignments and expenses, and sit in the cash flow on their own dates. Accruals can be reversed at the next data date. Every import is a batch that can be removed.
Forecast and cash flow
The Forecast tab shows cost, labour hours or FTE by period: actual to date, remaining by the schedule, cumulative, against each baseline, with the peak manpower and the headcount by trade. Every table exports to CSV.
Schedule and cost risk
The Risk panel sets up a Monte Carlo analysis. Quick risk gives every activity a three-point estimate as percentages of its duration (triangle, BetaPERT or uniform); an activity's Risk tab refines it. Correlation within a WBS keeps estimates moving together. Risk factors scale the durations of the activities they are assigned to with a chance of occurring; weather calendars take days out by period or close a season with uncertain start and finish dates. Activities can be probabilistic (may not exist), links can be probabilistic, and branches pick one successor path by probability. Cost uncertainty applies to resource rates and expenses.
A run reschedules the whole network in every iteration, with Latin hypercube or Monte Carlo sampling and a fixed seed. The Risk tab in the bottom pane shows the finish and cost distributions with P-dates, the joint confidence of meeting both, each activity's criticality and sensitivity, and the drivers. Runs before and after the register's responses, or with and without a change, are saved as scenarios and compared on one chart. P50 to P80 bars can be drawn on the Gantt.
The basis and review of the estimates. Every three-point estimate records where it came from (Quick risk, a company range rule, expert judgment, a vendor or contractor quote, historical data, an analogous activity, or set by hand), its basis in words, and a review status: draft, reviewed or accepted, with who reviewed it and when. Changing an estimate's numbers sends it back to draft. The company's range rules (Portfolio › Enterprise › Risk ranges) give standard ranges by estimate class, WBS, activity code, resource or activity name; a project applies them from the Risk drawer, the first rule that fits each activity setting its range as a draft with the rule's basis. Class defaults for Classes 1 to 5 are one click away as a starting point. The Risk drawer lists every estimate with its source, basis and status, filters drafts and those without a basis, and reviews or accepts them in bulk; each run records how well founded its inputs were, and the risk report carries a Basis of the duration estimates section.
Cost uncertainty. The run costs every iteration: resource hours follow the sampled durations (crew × hours × rate), register risks add their cost when they occur, and the cost already spent stays fixed. Correlated cost factors add price uncertainty the way it behaves in practice: each factor (an escalation on all labour, on equipment and materials, on the expenses still to come, on chosen resources or on the whole project) is drawn once an iteration and moves everything it covers together, which independent per-resource ranges understate. A cost-loaded project's first run switches on default factors as drafts with a stated basis; like the duration estimates, each factor records its source, basis and review (draft, reviewed, accepted, by whom and when), returns to draft when its numbers change, and appears in the risk report's Cost uncertainty section. Duration (productivity) factors can be assigned to every activity using a trade, and carry a basis and review too.
The risk register
The Register panel holds threats and opportunities with cause, event, effect and trigger, an owner, a probability and cost and schedule impacts before and after the response, the response and its actions, and the activities affected. The heat map uses your organization's matrix. Modelled risks enter the simulation as events on their activities.
The contingency ledger sits at the top of the register. It holds the contingency budget (opened by the estimate's hand-off, or set here), how the remaining is held against the open threats by their expected value after response, and every movement: a draw when a threat occurs or an approved change is funded from contingency, a release when a risk is retired or closed or at a milestone review, a transfer to or from management reserve or another project, an adjustment when the estimate is re-baselined. Changing a risk's status proposes the matching entry and implementing a change request with a cost proposes a draw; the ledger's keeper confirms, edits or removes each proposal, so nothing moves on its own. The tiles show budget, drawn, released, remaining, held against open risks, unallocated and the open-threat exposure with its cover; the chart shows the remaining over time.
Change requests and what-if scenarios
A change request (Changes req. panel) has a title, category, reason, requester, estimate and the activities it touches, and moves through draft, submitted, under review, approved or rejected, implemented or withdrawn, with a history. Model it in a scenario makes a what-if copy of the project; change durations, logic, crews, rates or add work there, and the impact on the finish, cost, hours and peak manpower is measured against the live project. Approve, then promote the scenario to apply its changes, or implement by hand.
The What-if panel also models the remaining work in bulk: productivity, crews, rates, expenses, scope growth, a hold on work not started, and crashing with overtime, extra crews, bonus or fast-tracking on the critical path or a WBS.
The Changes panel is the change log: every recorded change with who, when, what and the effect on the finish and the budget.
Exploring what-ifs. Instead of guessing scenarios one at a time, the What-if drawer searches them. The time–cost trade-off tries every combination of overtime (+2 h, +2 h with Saturdays, +4 h with Saturdays), a night shift, crews ×1.5 or ×2 and 25% or 50% overlap of finish-to-start links, on the critical path, the near-critical work or everything in a chosen WBS. Each one is a full reschedule of the network, costed with your premiums, shift differentials and productivity. It plots finish against cost, draws the efficient frontier (nothing else is both sooner and cheaper), shows the cost per day saved, and names the cheapest option that meets a target finish; any option becomes a scenario in one click. The sensitivity moves each lever on its own (productivity, crew size, scope growth, a delayed start, rates, expenses, the work week) and ranks them by how far they move the finish and the cost. A scenario's what moved lists the activities whose finish changed most and what became or stopped being critical. The forecast model can be aimed at the whole project, any WBS level, the critical path or the selected activity.
Activity codes, layouts and views
Codes define code types (area, discipline, system, contract) with values and colours; assign them in the Details pane. The table can be grouped by WBS, by a code type or not at all, filtered to open, critical, behind or started, and sorted. Layout chooses the columns from the full list (dates, floats, variances, resources, costs, earned value, quantities, steps, risk results, counts) and saves the arrangement as a named view. Bars can be coloured by status, float, risk criticality, WBS or code.
Links between projects
An activity can have a predecessor or successor in another project in the same browser or workspace. The other project's dates drive this one at scheduling; both projects keep the link. The Portfolio timeline shows them.
Reports and printing
Report builds a project report pack: status summary, earned value, schedule, milestones, resources, risk, change log, with your sections picked and a cover. Print prints the schedule as laid out, to PDF through the browser. Every table in the product exports to CSV; XER exports the schedule to the enterprise scheduler.
From P6. An XER brings the WBS, activities, relationships, calendars (resource calendars included, so resource-dependent activities schedule as in P6), resources and rates, assignments with actuals, expenses, activity codes, steps, the OBS and project codes, and the cost accounts the assignments and expenses charge to, each activity charged to the account carrying most of its budget. On a reference set of P6 sample projects the forecast finish agrees with P6 to the day; projects linked to other projects by relationships need those projects in the same file.
From and to Microsoft Project. Open a Project XML file (File > Save As > XML in Project) and the outline becomes the WBS and the activities, with durations, remaining durations, actual dates, per cent complete, constraints, milestones, predecessor links with type and lag, calendars with working times and exceptions, resources with rates, assignments with work and cost, cost resources as expenses, and baseline 0 as the active baseline. The rail's Project button writes the open project the same way, scheduled, so Project opens it with the dates and logic the Planner produced. Earned value rules, risk, change requests, cost accounts and steps have no home in Project and stay in the Planner's own file. The binary .mpp file is proprietary: save it as XML in Project first.
Files, folders and the cloud
Save writes a .planner.json. An autosave folder keeps every project written as you work with daily backups. A cloud workspace syncs every save to the server and shares with members; a newer version saved by someone else is never overwritten silently. See Data exchange and API and Connections.
The workspace (the cloud panel) is where a workspace is run. Every workspace has a tenant number (DS-0001 and so on), a random id and an optional short id, which name it in exports, backups and support requests. Members hold one of five roles: owner (everything, including billing and other owners), admin (members, roles, single sign-on, connections, the audit log and exports), planner (changes projects and the enterprise setup), viewer and executive (read only; the apps open read-only for them, and the phone layout is made for executives). Seats count owners, admins and planners; viewers and executives are free on every plan. An owner or admin can require Microsoft sign-in for the workspace, optionally from one Microsoft tenant; that is set from a Microsoft session so nobody locks themselves out, and workspace API keys are not affected. The audit log lists who did what, newest first: sign-ins, invitations, role changes, project saves and deletions, connection and key changes, exports. Export the workspace downloads everything it holds, projects included, as one JSON file.
Keyboard
| Keys | Action |
|---|---|
| Ctrl + S | Save the project file |
| Ctrl + Z / Ctrl + Y | Undo / redo |
| Enter, Tab in the table | Next row, next column |
| Esc | Close the open panel |
| Right-click | Context menu on an activity or WBS node |